
Supply Chain Insights
Top 10 Root Cause Analysis Processes

Root Cause Analysis (RCA) is essential for tackling supply chain, CPG, and retail challenges. Operational breakdowns cost businesses millions in revenue, productivity, and customer trust.
Supply chain bottlenecks, production delays, and inaccurate forecasting may seem like isolated incidents but are often symptoms of deeper inefficiencies. When teams focus on short-term fixes – like expediting shipments, adjusting schedules, or increasing inventory, they miss the root causes of recurring problems. This reactive approach means repeated disruptions, higher costs, and operational instability.
Without a clear method to diagnose and fix problems, businesses remain reactive. Root Cause Analysis methods help identify hidden inefficiencies and prevent future disruptions.Lumi AI and other AI-driven data analytics tools accelerate data exploration, collection, and hypothesis testing, enabling organizations to quickly identify trends, inefficiencies, and root causes. These tools can be utilized in conjunction with Root Cause Analysis (RCA) techniques to accelerate the RCA process, including 5 Whys, Fishbone Diagram, and Failure Mode and Effects Analysis (FMEA). By integrating AI with these methodologies, businesses can enhance diagnostic accuracy, reduce manual effort, and drive proactive, data-driven decision-making to prevent future disruptions.
This guide will highlight 10 Root Cause Analysis techniques to solve problems effectively, reduce costs, and create long-term operational stability.
Introduction to Root Cause Analysis (RCA)
Root Cause Analysis (RCA) aims to discover the root cause of a problem or event, emphasizing actionable analysis for effective problem-solving
In supply chain and retail operations, RCA evaluates procurement processes, inventory management, and customer behavior to determine the sources of issues such as stockouts, overstocking, and declining sales.
By uncovering these root causes, businesses can develop proactive strategies to mitigate risks and enhance overall performance.
What is Root Cause Analysis?
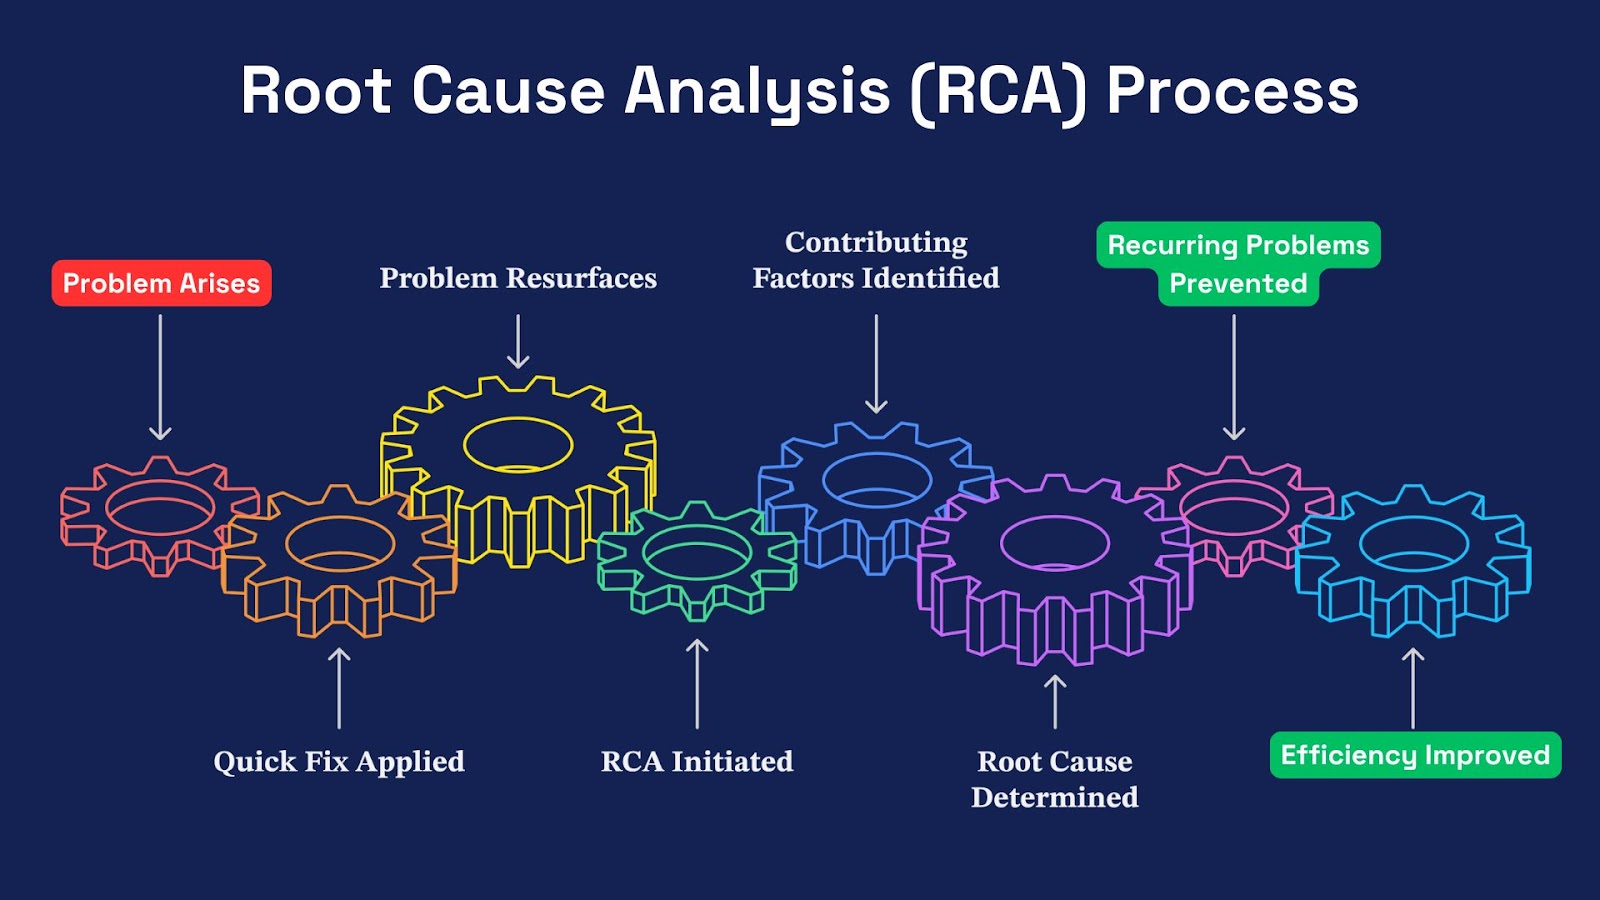
Root Cause Analysis (RCA) is a methodical problem-solving tool to find the underlying cause of an issue rather than just the symptoms.
When problems arise – such as supply chain disruptions, product defects, or operational inefficiency, businesses often apply quick fixes that fix the problem temporarily. But without digging deeper to find the root cause, the same problems resurface, and we have recurring failures, financial losses, and inefficiencies.
RCA helps businesses break this cycle by systematically analyzing events, identifying contributing factors, and determining the root cause. The following sections will examine the most effective Root Cause Analysis Tools and how they can change your problem-solving approach.
The Role of Data Analytics in RCA
Integrating data analytics into Root Cause Analysis (RCA) enhances its effectiveness. Advanced RCA tools use data analytics to detect patterns in incident data, exposing supply chain inefficiencies.
Machine learning reveals hidden correlations among supply chain variables, pinpointing issue causes. Organizations adopt these advanced analytics to boost decision-making, implement precise interventions, and optimize supply chain operations.
The use of artificial intelligence to transform data analytics platforms, such as Lumi AI, enhances the entire Root Cause Analysis (RCA) process by greatly increasing the gathering, investigation, and pattern recognition capabilities.
Advanced analytical tools support traditional RCA methodologies such as the 5 Whys, Fishbone Diagrams, and Failure Mode and Effects Analysis (FMEA). As a result, organizations can identify core issues much faster than before.
By combining artificial intelligence-driven analytical insights with established RCA protocols, companies will require much less manual analysis, increase diagnostic accuracy, and implement evidence-based, proactive steps to address recurring operational issues.
Essential Root Cause Analysis Methods
A full implementation of Root Cause Analysis (RCA) methods in supply chains, consumer packaged goods (CPG), and retail companies is necessary for solving operational disruptions. The following tools provide a systematic approach to solving problems:
1. Ishikawa (Fishbone) Diagram
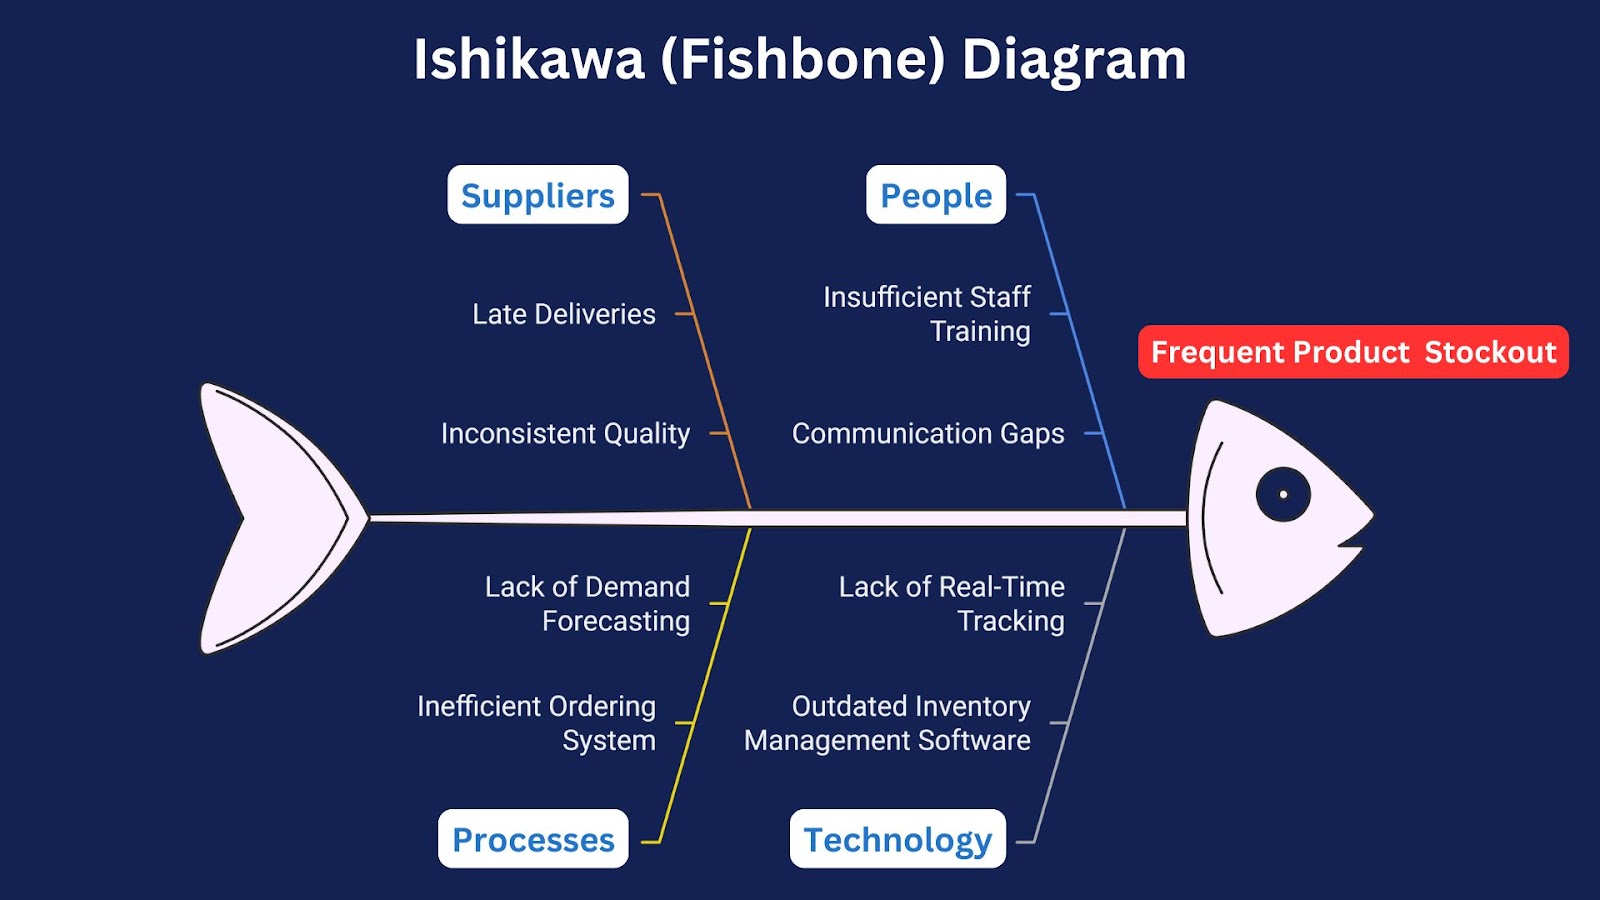
The Ishikawa Fishbone Diagram is a visual tool used in root cause analysis to systematically identify and display all possible causes of a specific problem or effect.
It resembles a fish skeleton, with the main problem at the "head" and potential causes branching off as "bones." This method helps teams categorize and examine factors contributing to issues, facilitating a comprehensive understanding of underlying causes.
This structured approach enables organizations in the supply chain, consumer packaged goods, and retail sectors to systematically identify and address the root causes of operational challenges, leading to enhanced efficiency and performance.
2. Pareto Chart
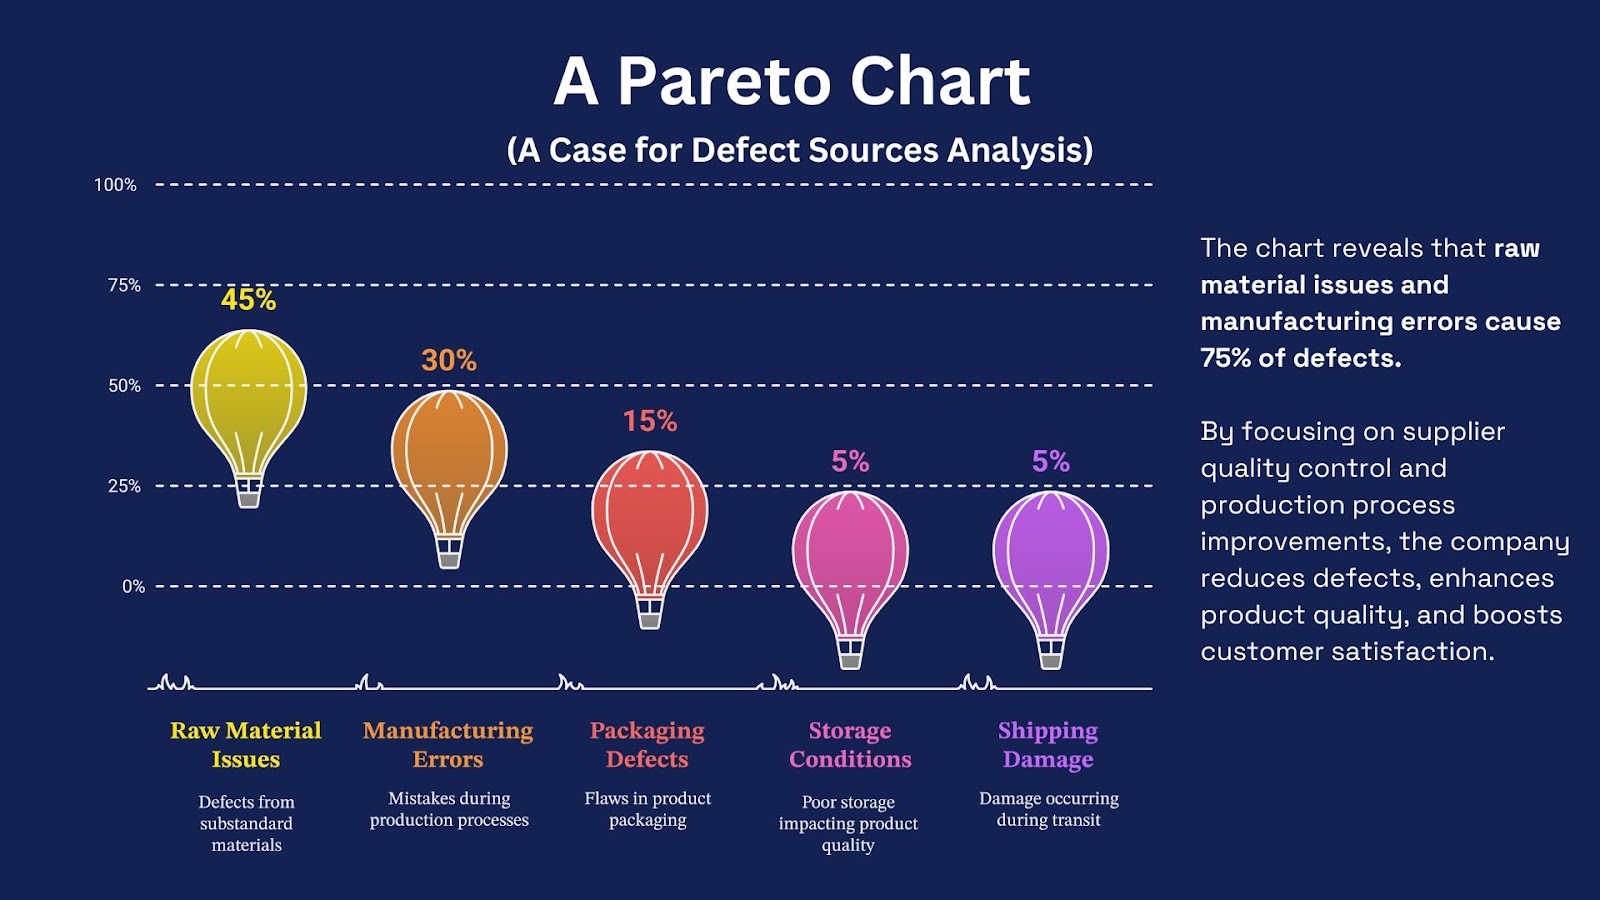
A Pareto Chart is a visual tool used in root cause analysis to identify the most significant factors contributing to a problem. Based on the 80/20 rule, it highlights that 80% of issues stem from 20% of causes.
The chart combines bars (to show individual factors) and a line graph (to display cumulative impact), helping businesses prioritize problem-solving efforts efficiently.
- Visual clarity: Highlights key issues.
- Prioritization: Focuses on major factors.
- Resource efficiency: Target key improvement areas.
- Decision support: Aids strategic problem-solving.
- Impact assessment: Evaluates category effects.
3. 5 Whys Analysis
The 5 Whys Analysis is a systematic root cause analysis methods that helps businesses uncover the fundamental causes of operational inefficiencies. By repeatedly asking "Why?" organizations move beyond surface-level issues to implement sustainable, data-driven solutions.
By leveraging predictive analytics, machine learning, and automated reporting, businesses can uncover trends, optimize decision-making, and prevent recurring problems.
For example, a retail company struggles with frequent inventory stockouts of high-demand products.
- Why is the product out of stock? → Demand exceeded supply.
- Lumi-AI analyzes sales patterns and queries data sources to forecast demand spikes, revealing that demand exceeds supply.
- Example Lumi-AI Prompt:“What is the count of the number of stockouts over the last 6 months per month?”.
- Why was demand underestimated? → Inaccurate historical sales data.
- Lumi AI can analyze, and forecast predictions to assess historical accuracy, identifying specific moments of inaccuracy for deeper analysis
- Why was outdated data used? → Manual forecasting methods.
- Why are manual forecasting methods in place instead of automation? → Lack of integration with existing ERP systems.
- Lumi-AI can integrate with existing ERP and inventory systems to get direct and updated data.
- Why is integration delayed? → Limited technical expertise.
Root Cause Identified: Outdated manual forecasting leading to inventory mismanagement.
Lumi-AI accelerates data collection, trend analysis, and predictive analytics, enabling automated inventory management, demand forecasting, and stockout prevention. Optimize your organization's supply chain with AI-driven efficiency and real-time insights.
4. Failure Mode and Effects Analysis (FMEA)
Failure Mode and Effects Analysis (FMEA) is a risk assessment tool that systematically identifies potential failures in processes, products, or systems. It evaluates the severity, occurrence, and detection of failures, assigning a Risk Priority Number (RPN) to prioritize corrective actions.
By proactively addressing high-risk areas, businesses can minimize disruptions and improve operational efficiency.
For example, a CPG manufacturer experiences frequent damaged products upon delivery. Using FMEA, they assess failure risks:
- Failure Mode: Damaged products in transit
- Effects: Customer complaints, returns, revenue loss
- Causes: Poor packaging, rough handling, weak materials
- Severity: 8 (High impact)
- Occurrence: 7 (Happens often)
- Detection: 5 (Not easily detected)
- RPN Calculation: 8 × 7 × 5 = 280 (High risk)
Solution: By prioritizing packaging improvement and supplier handling training, the company reduces damage rates, lowers costs, and enhances customer satisfaction.
FMEA helps supply chain, CPG, and retail industries focus on the highest priority issues to reduce risks, improve quality, and enhance efficiency.
5. PROACT® RCA Method
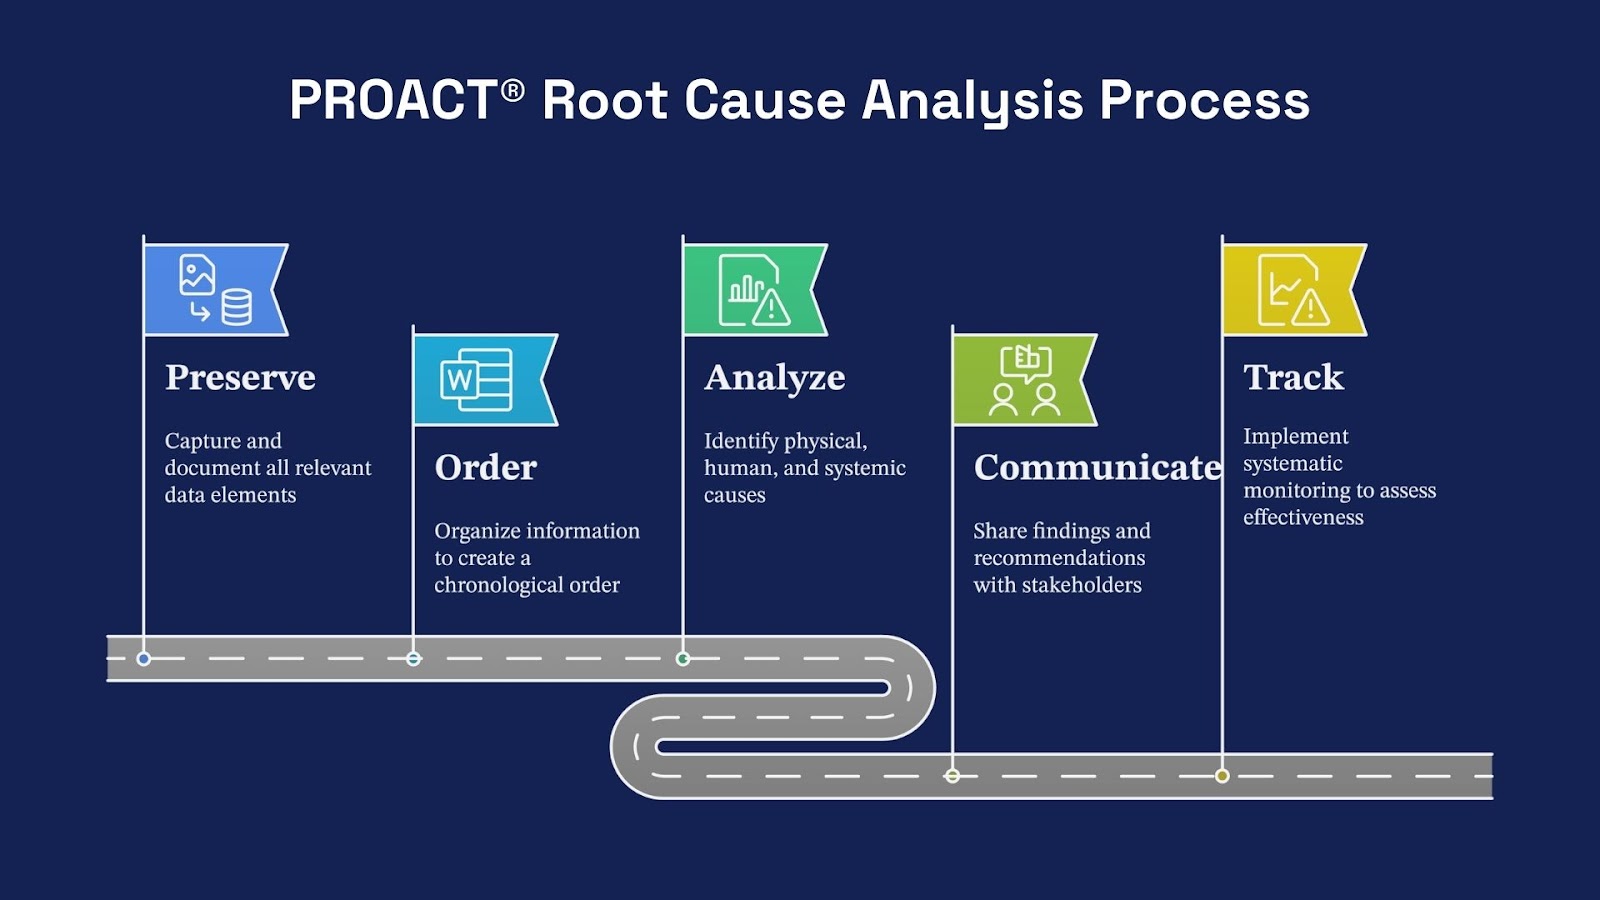
The PROACT® Root Cause Analysis (RCA) Method is a comprehensive analytical process used to identify and solve root cause problems in an organization. The name PROACT is an acronym for the five steps in the process: Preserve, Order, Analyze, Communicate, and Track.
Use Case: A consumer packaged goods (CPG) manufacturer observes a statistically significant increase in product returns due to packaging integrity failures.
- Preserve: Collect defective packaging samples, customer return documentation, and production records.
- Order: Create a chronological order of events to establish a precise temporal and spatial pattern of packaging defects occurring in production.
- Analyze: Determine that the packaging failure was caused by improper seal formation, equipment misalignment (physical root cause), inadequate operator training to detect equipment misalignment (human root cause), and lack of preventive maintenance protocols (latent root cause).
- Communicate: Present detailed findings to management and recommend adopting scheduled maintenance procedures, additional operator training, and standardized equipment inspection procedures.
- Track: Monitor packaging defect rates and product returns after corrective action implementation to verify the effectiveness of the implemented solutions.
When organizations apply the PROACT® RCA Method in a structured and disciplined manner, they can consistently identify and eliminate the root causes of operational problems, which in turn can be expected to result in a corresponding increase in product quality metrics and customer satisfaction indicators.
6. Affinity Diagram
The Affinity Diagram is a systematic approach to analyzing data in organizational planning. It is a method of organizing large amounts of information according to their natural relationships or correlations. This process helps organizations identify patterns and themes that give a deeper understanding of complex issues and situations.
How to use it:
- Gather Data: Collect all relevant information, observations, and data points, usually through facilitated group idea-generation sessions.
- Individual Element Documentation: Transfer each discrete piece of information onto separate physical or digital documentation units such as index cards or adhesive notes.
- Systematic Classification: Arrange documentation units with thematic concordance into logical groupings based on identified similarities.
- Categorical Designation: Develop descriptive headers that comprehensively describe each grouped classification, effectively capturing the primary concepts represented.
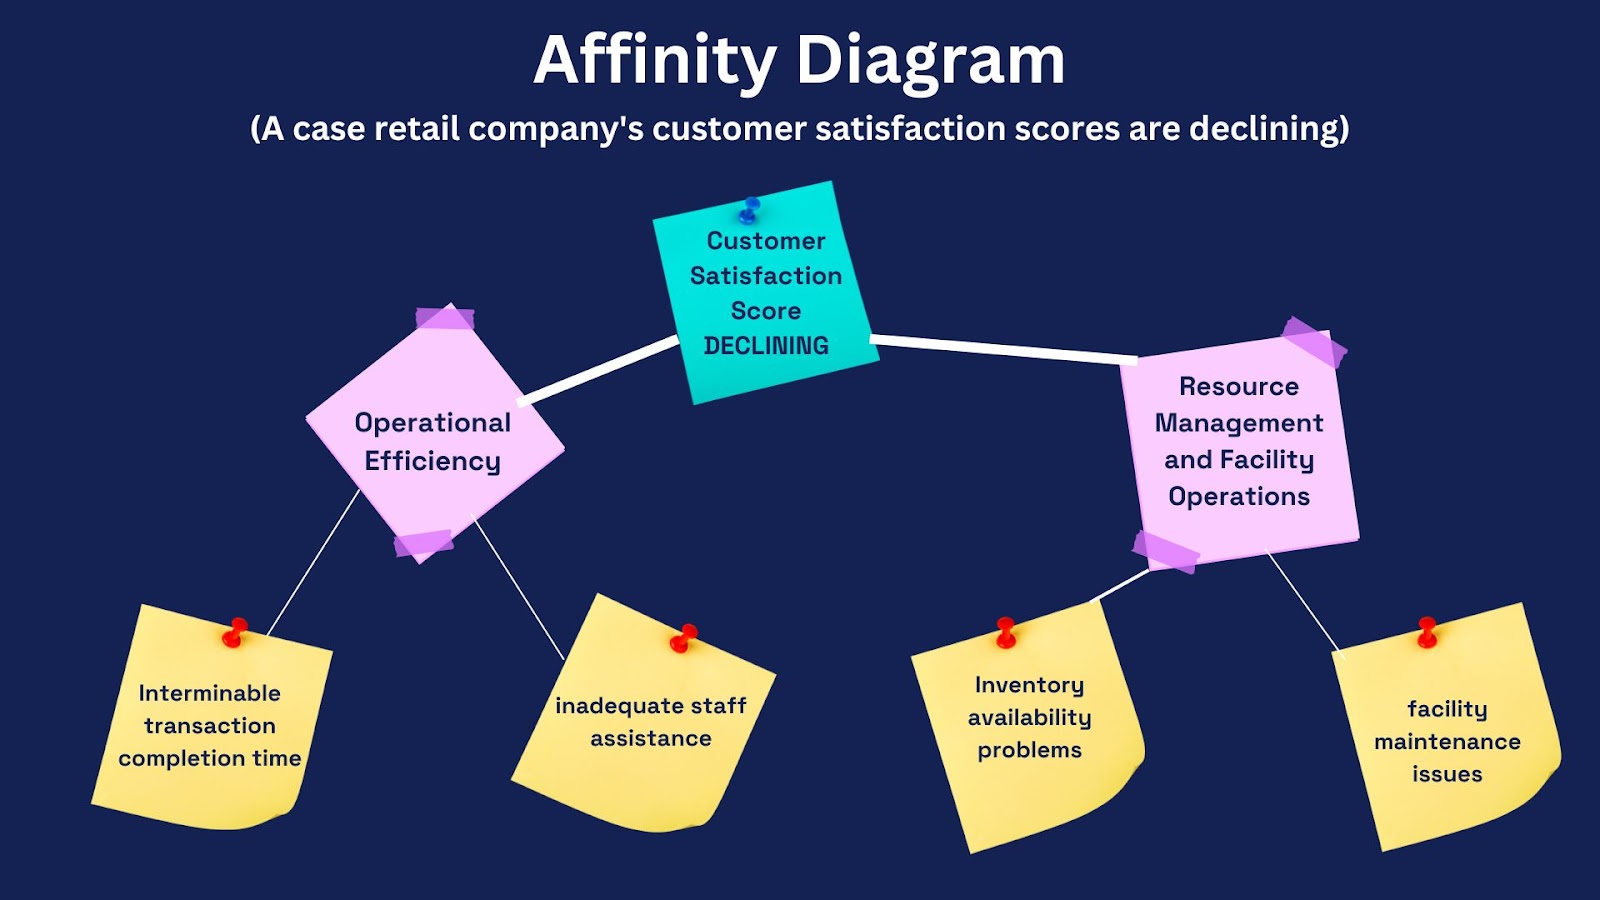
- Example of Use in Retail or Supply Chain Operations:Context: A retail company's customer satisfaction scores are declining.
- Scenario: An analysis team gathers customer feedback, employee observation, and numerical sales data.
- Process: The analysis team documents individual observations such as "interminable transaction completion time," "inadequate staff assistance," "inventory availability problems," and "facility maintenance issues."
- Classification: The analysis team places "interminable transaction completion time" and "inadequate staff assistance" under the category "Operational Efficiency."
The analysis team places "inventory availability problems" and "facility maintenance issues" under "Resources and Facilities."*
Classification Designation: The primary categories are formally designated as "Operational Efficiency" and "Resource Management and Facility Operations."
Through this systematic organizational methodology, The Affinity Diagram helps enterprises pinpoint critical operational challenges and develop targeted strategies to improve customer satisfaction.
7. Fault Tree Analysis (FTA)
Fault Tree Analysis (FTA) is a systematic, hierarchical approach used in system reliability engineering to break down an undesired event into its contributing causes logically.
The analysis starts with identifying a specific top event, and then the method breaks down this event into contributing factors using a hierarchical diagram with logical operators. This hierarchical approach visualizes potential failure pathways and enables organizations to quantify occurrence probabilities.
The Application in Supply Chain Operations:
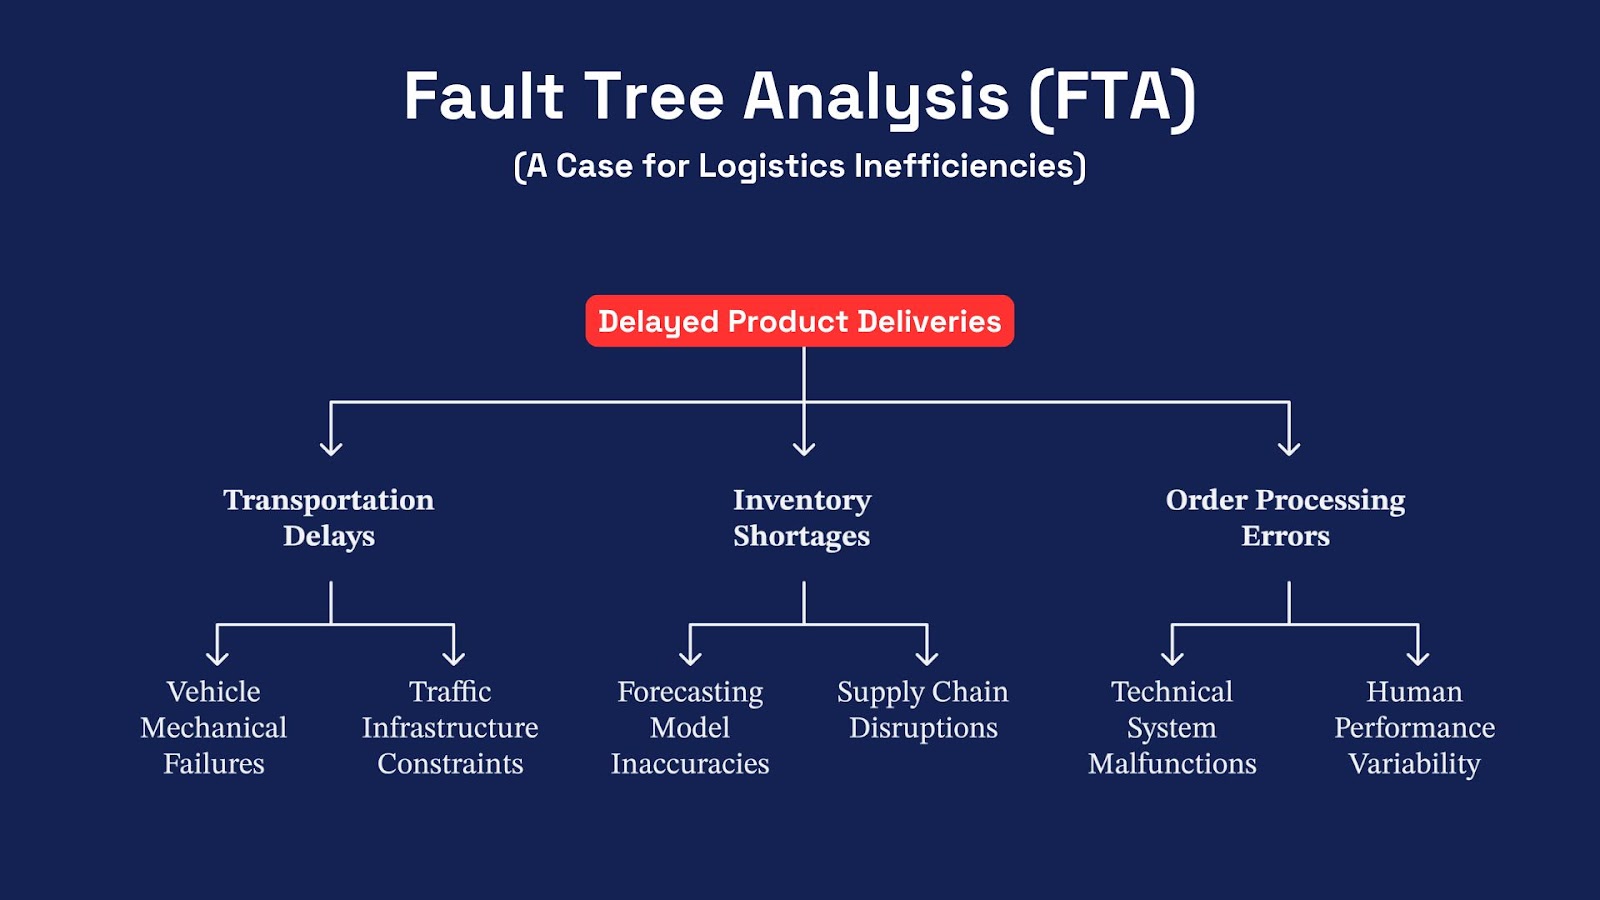
Operational Context: Consider a logistics organization with systematic inefficiencies in product delivery operations.
Methodological Implementation Protocol:
- Defining The Top Event. In this case, the top undesired event is “Delayed Product Deliveries.”
- Identify primary causal factors contributing to the top event: The methodology requires that the methodological implementation protocol for the top event includes the identification of the basic contributing elements such as “Transportation Delays,” “Inventory Shortages,” and “Order Processing Errors.”
- Fault Tree Development: Each primary causal factor can be further subdivided into subordinate elements:
- Transportation Delays: "Vehicle Mechanical Failures" and "Traffic Infrastructure Constraints."
- Inventory Shortages: "Forecasting Model Inaccuracies" and "Supply Chain Disruptions."
- Order Processing Errors: "Technical System Malfunctions" and "Human Performance Variability."
- Probability Analysis: The resultant hierarchical structure allows for probability assessment of contributing factors and identification of critical intervention points.
- Intervention: Correct fundamental causal factors using appropriate vehicle maintenance, enhanced forecasting, and order processing methodologies.
Lumi AI enables comprehensive testing of fault tree hypotheses to identify primary causal factors, supporting organizations in applying FTA to uncover root causes of delivery inefficiencies and enhance performance.
8. DMAIC Template
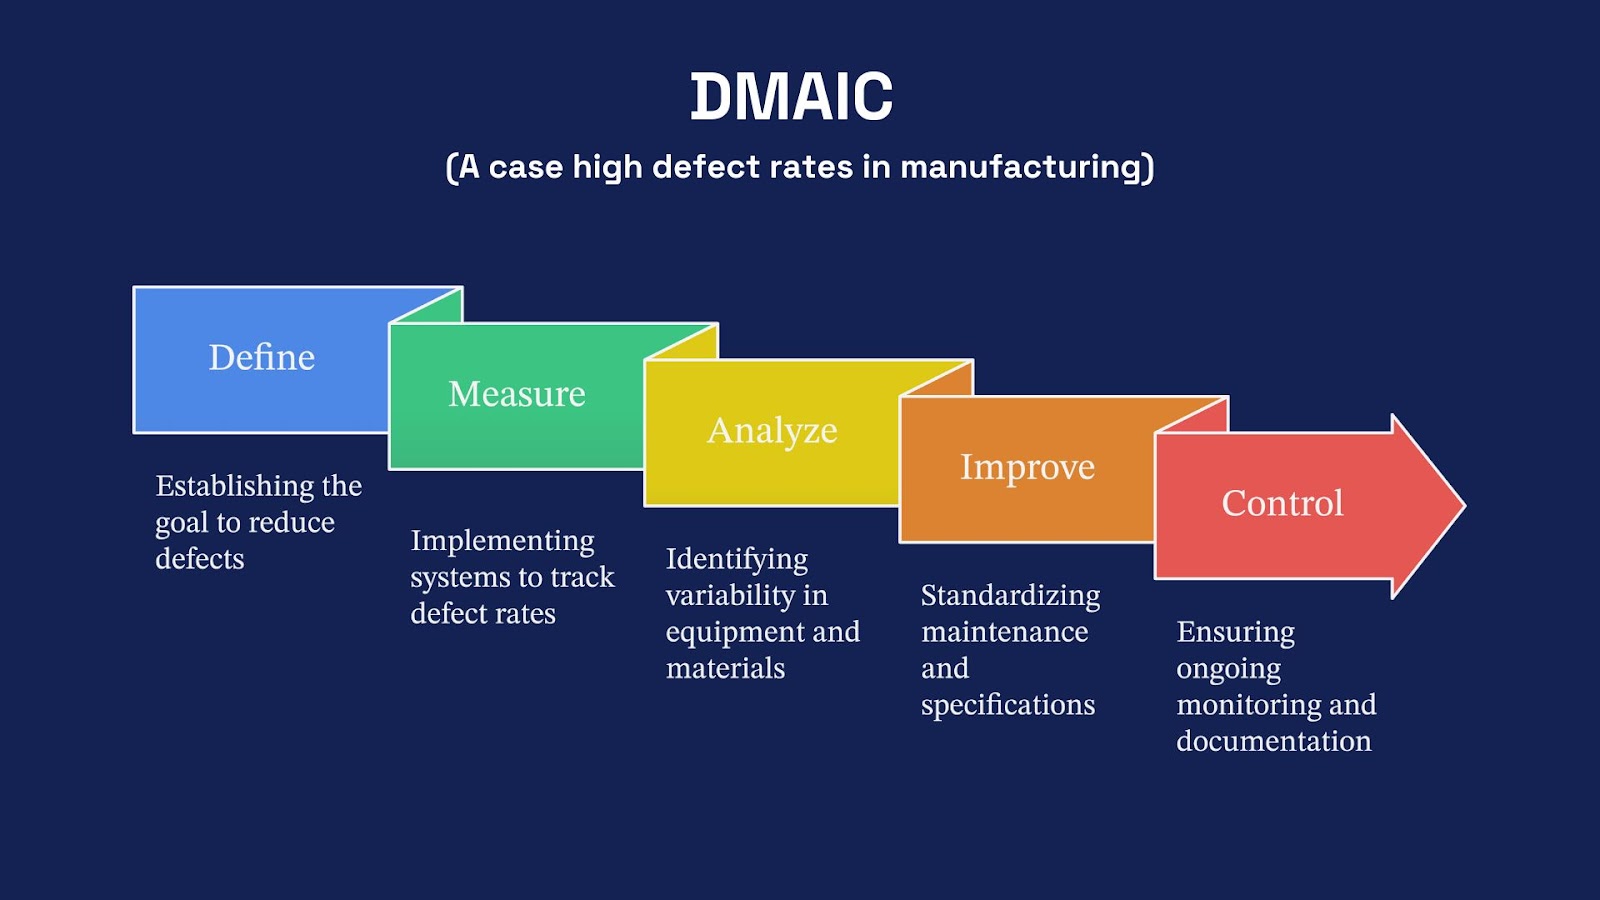
The DMAIC methodology is a structured, data-driven approach to process improvement that uses quantitative measurements and established analytical principles. It has 5 phases, each with a real-world example in Consumer Packaged Goods (CPG) manufacturing where a company has high defect rates resulting in increased operational costs and decreased customer satisfaction.
- Define – Establish a clear problem statement, measurable project goals, and specific customer requirements based on analysis.
- Example: In the CPG manufacturing example, the team identifies the root cause as too many manufacturing defects. It aims to reduce defects by 40% in 6 months to improve product quality and customer satisfaction.
- Measure – Collect and document relevant data points to establish a baseline of performance metrics.
- Example: The team tracks defect rates, production line efficiency, and quality metrics and finds that 15% of products don’t meet quality standards. This baseline measurement provides the data for further analysis.
- Analyze – Apply statistical and analytical techniques to identify root causes of inefficiencies or defects.
- Example: Upon analysis, the statistics show that the main causes of defects are equipment performance variability (run-to-run) and raw material specification deviations. These findings guide the solution development.
- Improve – Develop and implement targeted countermeasures to address root causes through deliberate action.
- Example: To address the root causes, the organization implements standardized equipment maintenance procedures and tighter raw material specifications, resulting in a statistically significant reduction in defects. These improvements ensure a more stable process.
- Control – Implement monitoring mechanisms and standardized procedures to ensure sustainability.
- Example: To sustain the improvements, the company has introduced continuous monitoring systems and standardized documentation of procedures. This ensures defects stay low through ongoing tracking and compliance, reinforcing a continuous process improvement culture.
By following the DMAIC methodology, CPG manufacturers can eliminate waste, improve product quality, and achieve long-term operational excellence. A structured approach ensures improvements are data-driven, measurable, and sustainable for continuous process optimization.
9. 8D Report Template
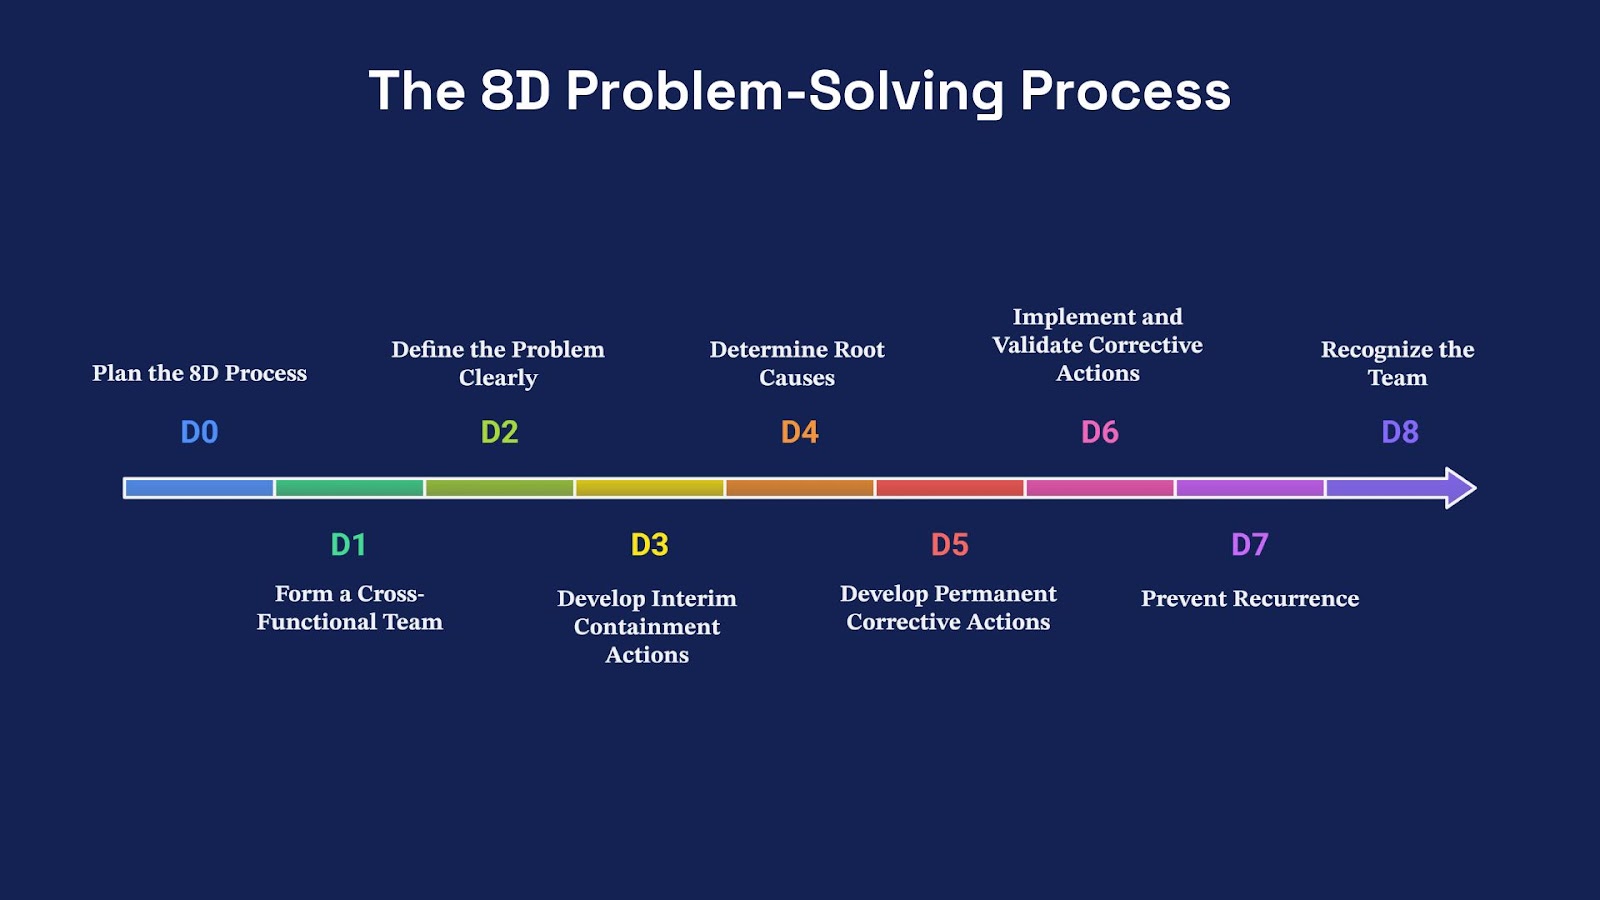
The 8D Report Template is a structured problem-solving tool to identify, correct, and prevent recurring issues in processes and products. Originally developed by the Ford Motor Company, 8D (Eight Disciplines) is a systematic approach to solving problems through teamwork, root cause analysis, and preventive action.
Each step of the 8D process ensures issues are thoroughly analyzed and resolved. Below example of the 8D methodology with a supply chain example of raw material delivery delays.
- D0: Plan – Prepare and Plan for 8D: Before you start the process, organizations need to define a structured approach, the scope of the problem, the resources required, and the objectives.
- Example: A manufacturing company in the supply chain is experiencing raw material delivery delays and is initiating the 8D process to solve the issue.
- D1: Form a Team – Assemble a Cross-Functional Group: A problem can only be solved with a cross-functional team with the necessary knowledge.
- Example: The company forms a team with members from procurement, logistics, and supplier management to cover all aspects.
- D2: Define the Problem – Describe the Issue: A clear problem statement, including impact and scope, must be defined based on data.
- Example: The team documents that 25% of the raw material deliveries in the last quarter were delayed more than 3 days, resulting in production stops and inefficiencies.
- D3: Develop Interim Containment Actions – Prevent Further Impact: Temporary actions to mitigate immediate consequences.
- Example: As an interim solution, the company builds up a buffer stock to prevent production disruptions while working on a long-term solution.
- D4: Determine Root Cause – Identify the Root Issue: Data-driven analysis is used to determine the underlying cause of the problem.
- Example: The investigation shows that the main causes of the delays are supplier schedules and bad communication between suppliers and logistics teams.
- D5: Develop Permanent Corrective Actions – Formulate the Solution: Permanent corrective actions to eliminate the root cause and prevent recurrence.
- Example: The company negotiates new delivery schedules with suppliers and introduces real-time shipment tracking for better visibility.
- D6: Implement and Verify Corrective Actions – Check Effectiveness: Execute corrective actions and continuously monitor their effectiveness.
- Example: The company rolls out the new schedules and tracking system, tracks supplier performance, and monitors delivery improvements over a defined period.
- D7: Prevent Recurrence – Strengthen Processes: To ensure long-term success, processes must be changed to prevent similar problems in the future.
- Example: Regular supplier performance reviews and improved communication protocols are introduced to maintain efficiency and to sustain delivery improvements.
- D8: Recognize the Team – Celebrate and Learn: Acknowledging the team’s work encourages engagement and a culture of continuous improvement.
- Example: The company formally recognizes the cross-functional team, celebrating its role in improving supply chain performance and operational reliability.
Using the 8D methodology, the company eliminates recurring delivery delays and improves supplier reliability and production continuity. This structured approach solves the immediate problem and builds a robust supply chain to ensure long-term efficiency and sustainability.
10. Scatter Diagram
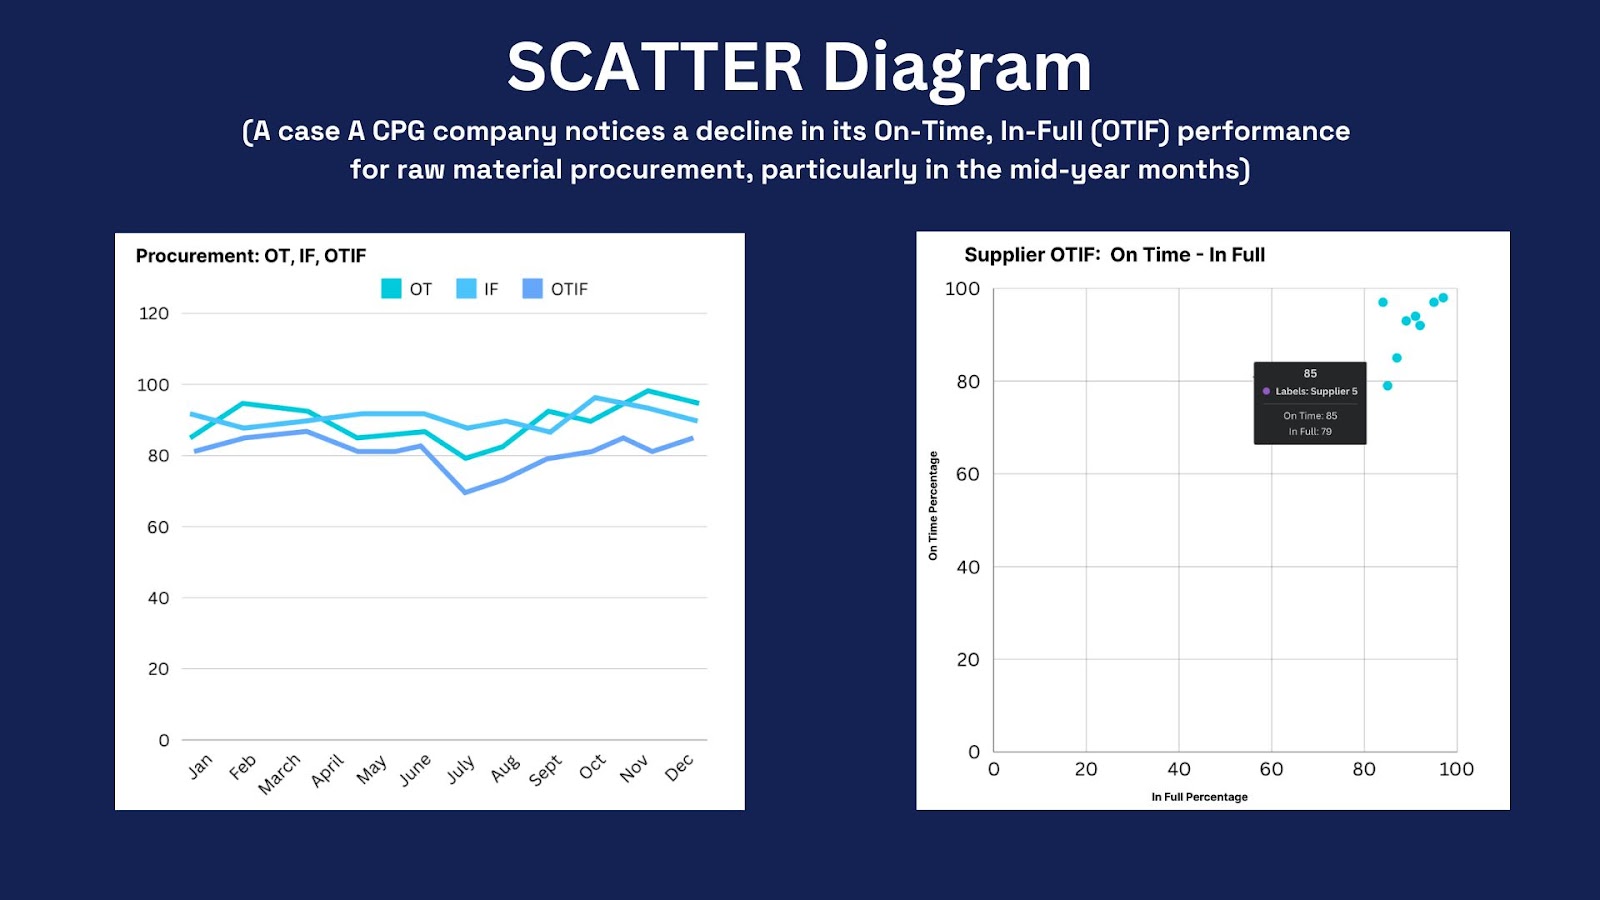
A scatter diagram, also known as a scatter plot, is an advanced graphical visualization that displays the mathematical relationship between two measured quantitative variables.
The chart comprises individual data points plotted according to their respective values for each variable, allowing analysts to identify associations, patterns, and trends in the relationship between the two measured parameters.
Sample case:
A Consumer Packaged Goods firm has experienced a mid-year drop in On-Time, In-Full (OTIF) performance on a key raw material. The OTIF metric measures on-time delivery, production continuity and vendor relations. This study aimed to identify supplier-specific factors that impacted the OTIF performance drop. Implementation Methodology:
1. Data Collection and Analysis Protocol
- Perform a complete collection of the supplier's performance metrics for a 12-month evaluation period.
- Segregation of performance data by the following criteria:
- Supplier Identification
- On-Time Delivery Performance Metrics
- In-Full Delivery Performance Metrics
- Composite OTIF Performance Indicators
- Time analysis with a focus on performance degradation June-July.
2. Visual Data Analysis Implementation
- Create a scatter plot visualization with the following characteristics:
- The horizontal axis should represent On-Time Delivery Performance (%).
- The vertical axis should represent In-Full Delivery Performance (%).
- The plots should display individual supplier performance indicators as discrete data points.
- Conduct a systematic analysis of performance outliers and clustering patterns.
3. Quantitative Performance Assessment
- Perform correlation analysis to assess the relationships between the patterns of delivery timing and completeness. Identify underperforming suppliers (performance below 80% OTIF threshold).
- Identify temporal patterns in performance.
4. Performance Enhancement Protocol
- Initiate supplier performance enhancement procedures. Performance-based contractual changes.
- Evaluating supplier diversification.
Lumi AI can generate time-series OTIF reports and supplier scatter plots to identify underperforming vendors, enabling data-driven decisions for vendor diversification and supply chain optimization.
Lumi AI: RCA with Artificial Intelligence
Lumi-AI integrates with ERP systems, planning software, and data warehouses to process vast amounts of data from multiple sources. This enables businesses to get answers to critical operational questions:
- Inventory Management: Lumi-AI can analyze sales history, seasonal trends, and supply chain logistics to identify patterns that cause overstocking or stock shortages. This helps businesses to optimize inventory levels, reduce excess stock, and prevent stockouts.
- Procurement and Supplier Management: By analyzing supplier performance metrics, delivery timelines, and quality control data, Lumi-AI can help identify inefficiencies or risks in the supply chain. Businesses can use this analysis to refine supplier selection and negotiation strategies for reliable and cost-effective procurement.
- Sales & Customer Insights: Lumi-AI can determine purchasing patterns, customer feedback, and market trends to see where consumer preferences are shifting and why sales are declining. This informs marketing strategies and product development so businesses can adapt to changing consumer demand.
Conclusion
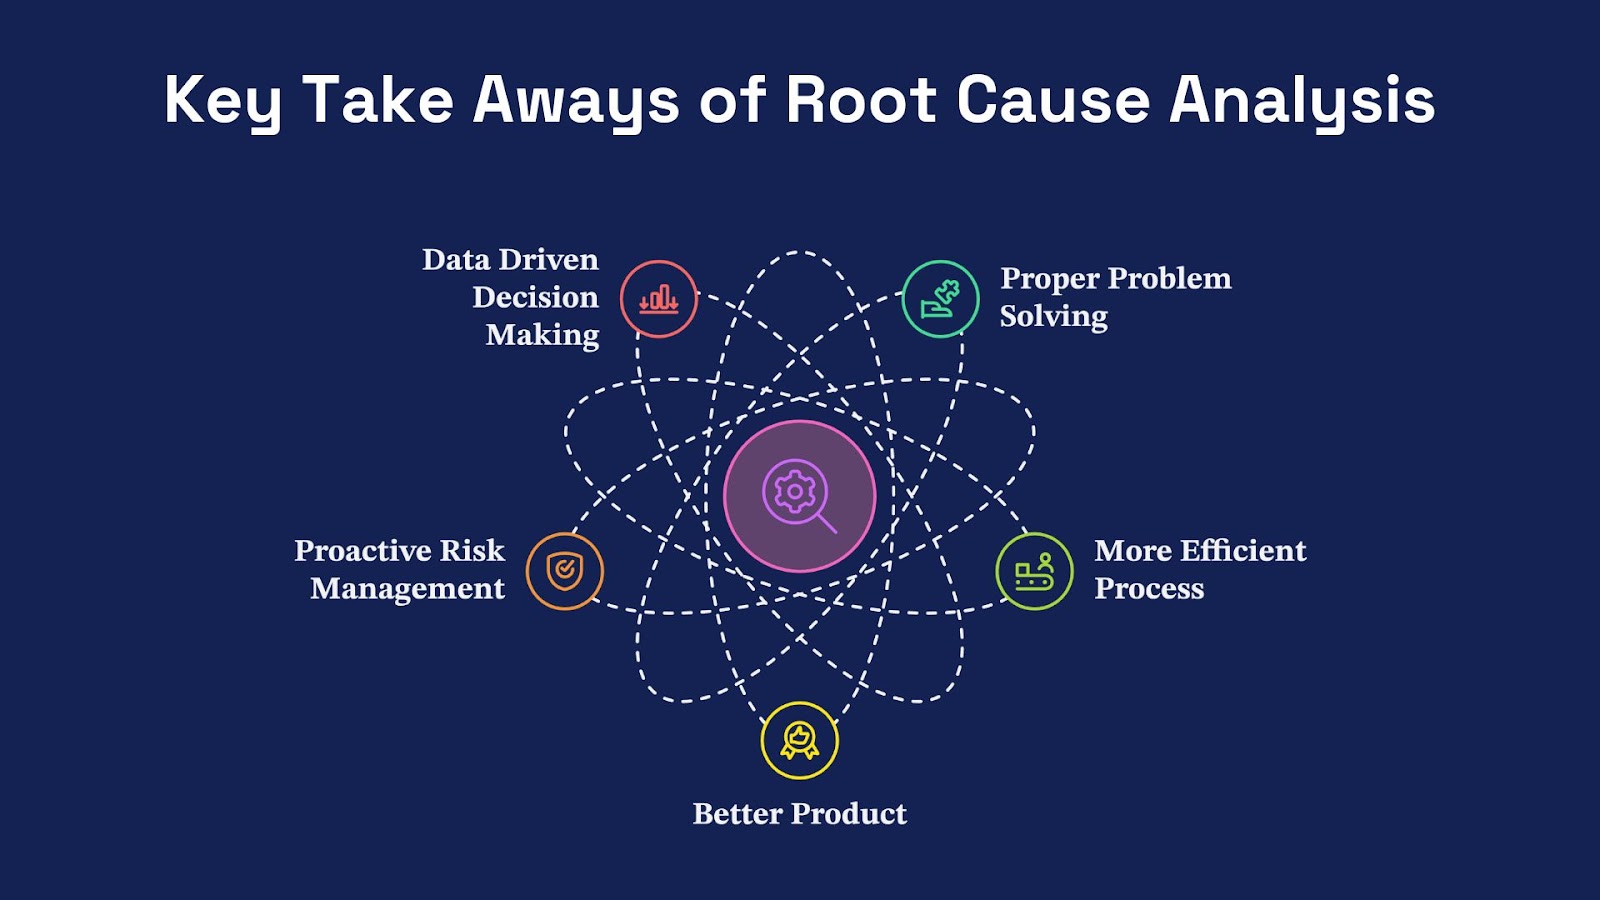
Using Root Cause Analysis (RCA) in the supply chain, consumer packaged goods (CPG), and retail is key to finding and fixing the underlying problems that can cause operational disruption. Here are five takeaways:
- Proper Problem Solving: RCA gives you a structured way to find the root cause of operational disruption, so you can get beyond surface-level symptoms and fix the core issue.
- More Efficient Process: By finding the root cause, you can implement targeted fixes, which means a more streamlined process, less waste and better resource utilization.
- Better Product: Fixing the underlying causes of product defects means higher quality output, more customer satisfaction, and brand loyalty.
- Proactive Risk Management: RCA lets you anticipate problems before they get out of hand, so you can put in place preventative measures and reduce the likelihood of future disruption.
- Data-Driven Decision Making: The analytical nature of RCA means decisions are based on fact, not fiction, so you can build a culture of continuous improvement and strategic planning.
By incorporating RCA into your operational strategy, businesses in these industries can be more resilient, agile, and successful in the long term.
FAQs
What is Root Cause Analysis (RCA), and why is it important for supply chain and retail industries?
Root Cause Analysis (RCA) is a systematic method of identifying and rectifying the underlying causes of operational disruptions in business processes.
Adopting RCA methodology can provide several operational benefits, such as process improvements, cost reduction, and performance enhancements, which can contribute to maintaining a competitive edge in supply chain and retail industry environments.
What role does data analytics play in modern RCA techniques?
Data analytics is critical to modern Root Cause Analysis (RCA) methodologies. It involves collecting and analyzing large data sets through sophisticated analytical processes.
Advanced analytics, including machine learning algorithms and statistical modeling techniques, can help to identify complex patterns and correlations that are not apparent when using traditional analytical techniques alone. This can improve the accuracy and efficiency of the RCA process.
How can Lumi AI improve the RCA process in CPG and retail?
Lumi AI offers advanced capabilities for Root Cause Analysis (RCA) in the CPG and retail industries by applying advanced data analytics and artificial intelligence-driven analytical capabilities.
The platform allows for in-depth investigation of performance issues through historical data analysis.
For example, supply chain analysts can analyze purchase quantity variances in warehouses, geographic regions, and supplier networks to reveal specific causative factors in inventory discrepancy events, all using plain language.

Anthony Scalzitti is a Value Engineer at Lumi AI, specializing in implementations and customer success. With a background in computer science and experience in AI strategy and analytics, he ensures Lumi’s solutions deliver real impact for customers.

Experience the Future of Data & Analytics Today
Make Better, Faster Decisions.